Data & Integration
Data & Analytics Dashboards
Contact for price
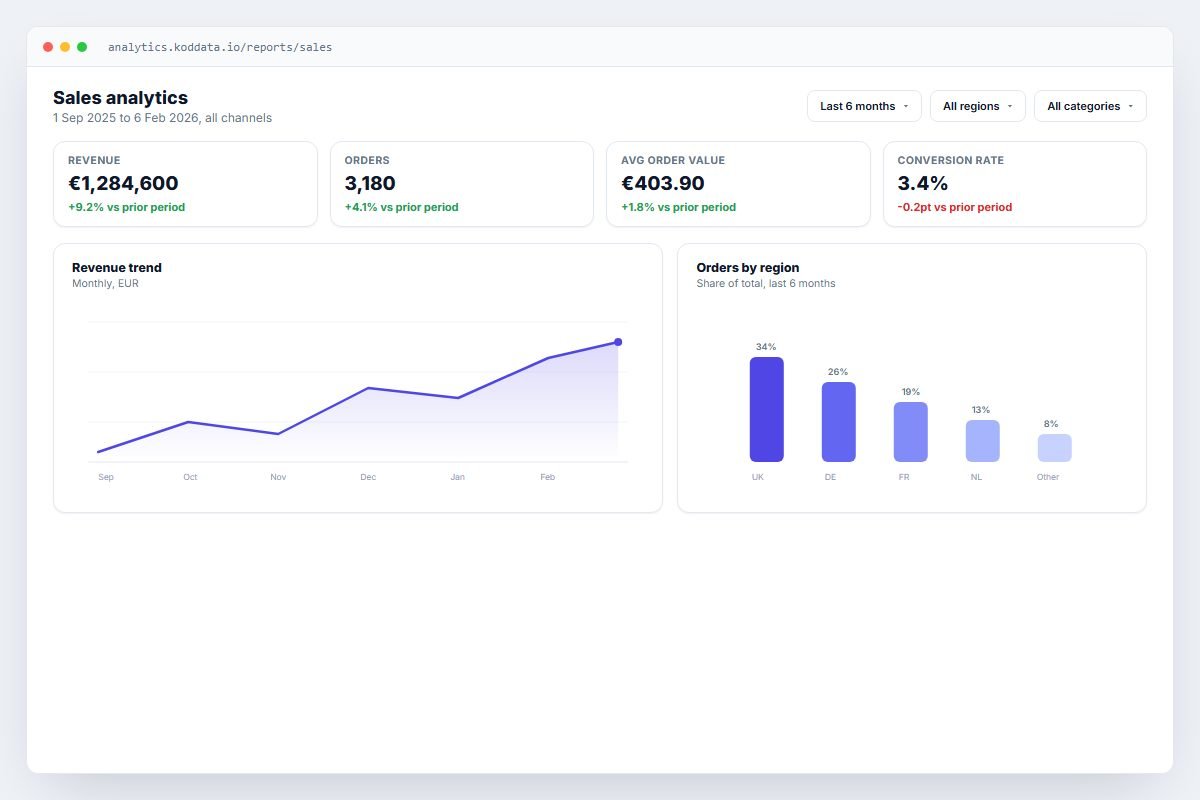
We build the pipelines that pull data out of operational systems such as your ERP, store or booking system, and the dashboards that turn it into numbers a manager can act on: sales by region, stock turnover, response times, conversion rates.
We start from the three or four decisions a dashboard actually needs to support, not a wall of charts nobody checks. Pipelines run on a schedule that matches how the business uses the numbers, hourly for operational metrics, daily for management reporting, and we document where each figure comes from so the dashboard survives a change of staff.
- Data pipelines from operational systems into a reporting store
- Dashboards for sales, stock, operations and support metrics
- Scheduled data refresh matched to how numbers are used
- Documentation of data sources and calculation logic
Technology: Python, PostgreSQL, React, AWS.